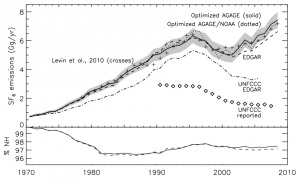
Sulfur hexafluoride (SF6) is a particularly potent greenhouse gas. It is used in large electrical equipment, and leaks into the atmosphere during maintenance. Once it is in the atmosphere, it is only destroyed if it reaches very high altitudes, making it last for hundreds to thousands of years. It is also a very strong absorber of infra-red radiation. These factors result in it being one of the most potent greenhouses yet discovered. One tonne of emissions is thought to be equivalent to releasing over 22,000 tonnes of CO2.

In collaboration with many of my AGAGE and NOAA colleagues, we examined how concentrations of this gas have increased in the atmosphere since the 1970s, and determined global and regional emissions (see Atmospheric Chemistry and Physics paper). We find that concentrations of SF6 have increased by more than a factor of 10 since our first measurement in 1973. We also find that global emissions are now higher than ever, and have increased by almost 50% in the last 5-10 years.
We wanted to find out where this increase in emissions was originating from. To do this, we used measurements made by the AGAGE and NOAA monitoring networks and a three-dimensional chemical transport model. The model (called MOZART, developed by the National Center for Atmospheric Research), uses wind speeds and other meteorological information that have been calculated using weather forecasting models, to simulate how pollutants are transported around the world. By testing how this model responds to changes in emissions from different regions, we can use the measurements to find out where SF6 originated from.
There were two major findings from our work. Firstly, we find that it is very likely that all of the recent emissions increase is being driven by an increase in emissions from Asian countries that do not report detailed emissions to the United Nations Framework Convention on Climate Change (UNFCCC), such as China, India and South Korea. Secondly, we find that developed countries that do report emissions to the UNFCCC (e.g. USA, UK, Germany), are likely to be underestimating their emissions.
Downloads
EDGAR emissions interpolated to 5×5 degrees and scaled in each hemisphere using AGAGE measurements between 1970 – 2008 can be found here in NetCDF format.
Regionally optimized EDGAR emissions at 1.8×1.8 degrees for 2004-2005 and 2006-2008 can be found here in NetCDF format.
Optimized 3D mole fraction fields at 5×5 degrees, and 28 vertical (sigma) levels are here in NetCDF format (10MB).
