First continuous measurements of CO2 mixing ratio in central London using a compact diffusion probe

As we become more concerned about rising CO2 levels in the atmosphere, people are beginning to think about ways of monitoring emission rates.  In this pilot study, we investigated the potential for monitoring London’s CO2 using mixing ratio measurements in the city centre.

In order to obtain measurements of CO2 that are representative of a wide area, you need to measure at the top of a tower.  At the centre of the Imperial College campus, the 80m Queen’s Tower was an excellent location for CO2 monitoring (and, since there isn’t a lift, provided some much-needed exercise for an out-of-shape atmospheric scientist).
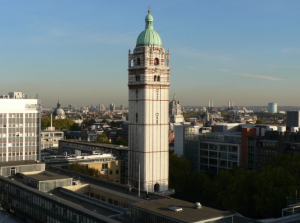
The Queen's Tower at the centre of Imperial College, South Kensington, London

We made one year of CO2 measurements during 2007 and 2008, and compared them to observations taken outside of London, made by Rebecca Fisher, Dave Lowry and Euan Nisbet at Royal Holloway University of London.

There were several surprising aspects to this work. We found that, generally speaking, the CO2 levels at 80m in London were not much higher than those outside, and were often significantly lower.  This is partly due to the differences in sampling heights.  The site outside London samples just above roof level, and is therefore likely to be more strongly influenced  by emissions from the local biosphere than the site in the city.  This potential influence of natural emissions close to the ‘background’ site makes it difficult to determine London’s CO2 emissions by comparing the two measurements.  However, we found that it may be possible to determine emissions during the winter, when natural emissions are very small.

London air pollution climatology: Indirect evidence for urban boundary layer height and wind speed enhancement

Urban areas modify the atmosphere above them in a number of ways.  There are many reasons for this, but broadly speaking, it is because they are rough and grey…  We think of cities as being ‘rough’ because of all the obstacles that the air has to pass over as it traverses them (houses, offices etc.).  On average, this means that a city will slow the air down as it passes over it, much like driving a car into sand. The ‘greyness’ of an urban area means that it can absorb more solar radiation than surrounding green areas.  This can make the air warmer above a city, a phenomenon known as the ‘urban heat island’.

Some people think that the urban heat island could cause a convection cell above a city…  If the city is hotter than the surrounding area, air will tend to rise above it because it will become less dense, drawing in air from the surrounding countryside.  So, even if the wind speed in the wider region is zero, we would expect a non-zero wind speed within the city.  However, this effect can be quite hard to measure using wind speed measurements, for example, because it varies significantly in space and time.

In the Atmospheric Environment paper “London air pollution climatology: Indirect evidence for urban boundary layer height and wind speed enhancement“, we try to identify the presence of an ‘urban heat island circulation’ over London using air pollution observations. The idea was that, if there is a heat island circulation, the wind speed (and boundary layer height) should be prevented from reaching very small values in London even if they are small outside the city, and therefore, pollutant concentrations shouldn’t be allowed to reach the very high values within the city.  By comparing pollutant concentration to regional wind speed and boundary layer height, we find that pollutant concentrations are more accurately predicted if we incorporate a minimum wind speed and boundary layer depth into a simple model of urban pollutant transport.  This is consistent with the presence of an urban heat island circulation in London.

Similarities of boundary layer ventilation and particulate matter roses

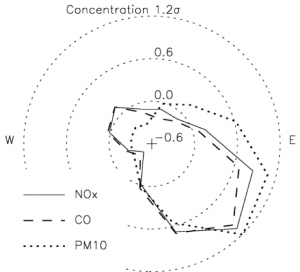
This paper was published in Atmospheric Environment back in 2006.  It examines the well-known increase concentration of particulate matter in the air over UK cities when the wind blows from the South-East.  It is generally assumed that this feature is due to transport from the continental Europe.  However, we show that, whilst long-range transport will certainly be responsible for much of the concentration increase, the weather conditions that occur when the wind blows from the South-East also have the effect of increasing the concentration of locally-emitted pollutants.

Average concentration of three pollutants in London as a function of wind direction. The scale is in standard deviations from the mean concentration.

One of the simplest ways of thinking about how the weather affects the concentration of urban air pollutants is to imagine that pollutants are emitted into a ‘box’ that sits over the city.  If the emission rate stays the same, we can still get changes in the pollutant concentration by either changing the rate that the wind blows pollutants through the box, or by changing the height of the box.

We all know what the wind speed changes all the time, so it’s easy to see how the wind can change pollutant concentration, but what determines the height of this imaginary box over a city?  Well, the idea of a ‘box model’ comes about because of the properties of the atmosphere close to the Earth’s surface.  High up in the Earth’s atmosphere, the air stays relatively unperturbed and travels in a relatively stable way.  However, in its lowest levels, contact with the surface makes the air turbulent (the wind becomes gusty).  The turbulence keeps the air well-mixed in this so called ‘boundary-layer’. This means that, as an approximation, we can assume that once pollutants are emitted, they are mixed throughout this layer.  So, the thinner this layer is, the smaller the ‘box’ and the higher the concentration of pollutants emitted into it.

It so happens that in the UK, when the air blows from the South-East, the average boundary layer height and the average wind speed are both lower (part of the reason that the boundary later is thinner is because the wind speed is lower).  Therefore, on average, we would expect pollutants emitted in UK cities to have a higher concentration in the atmosphere when the wind blows from the South-East than from other directions.  A similar effect was found at many locations around the world.